Market Focus
U.S. markets were closed on the 17th in observance of Dr. Martin Luther King day and markets will resume trading on the 18th. The benchmark U.S. 10 year treasury yield edged higher to 1.811% and the 30 year treasury yield also edged higher to 2.14%. China released its fourth quarter GDP for 2021 yesterday and the nation saw an 8.1% growth, year over year; however, retail sales figures missed expectations by about 2%. Furthermore, the central bank of China has decided to lower medium term loan rates in order to percent any economic slowdown. The current medium term loan rate set by the PBOC sits at 2.95%, and the central bank is lowering it by 10 basis points to 2.85%.
The cryptocurrency market once again retreated slightly after yesterday’s trading. Bitcoin lost close to 2% and is currently trading below 42,200; on the other hand, Ethereum experienced a deeper drop by 4.15% and is currently trading at 3210.
Main Pairs Movement:
The Dollar Index recovered from last Friday’s low and is currently trading above 95.25. Continued rising treasury yields have propelled the Dollar. A parallel shift of the yield curves could further fuel the Dollar’s demand.
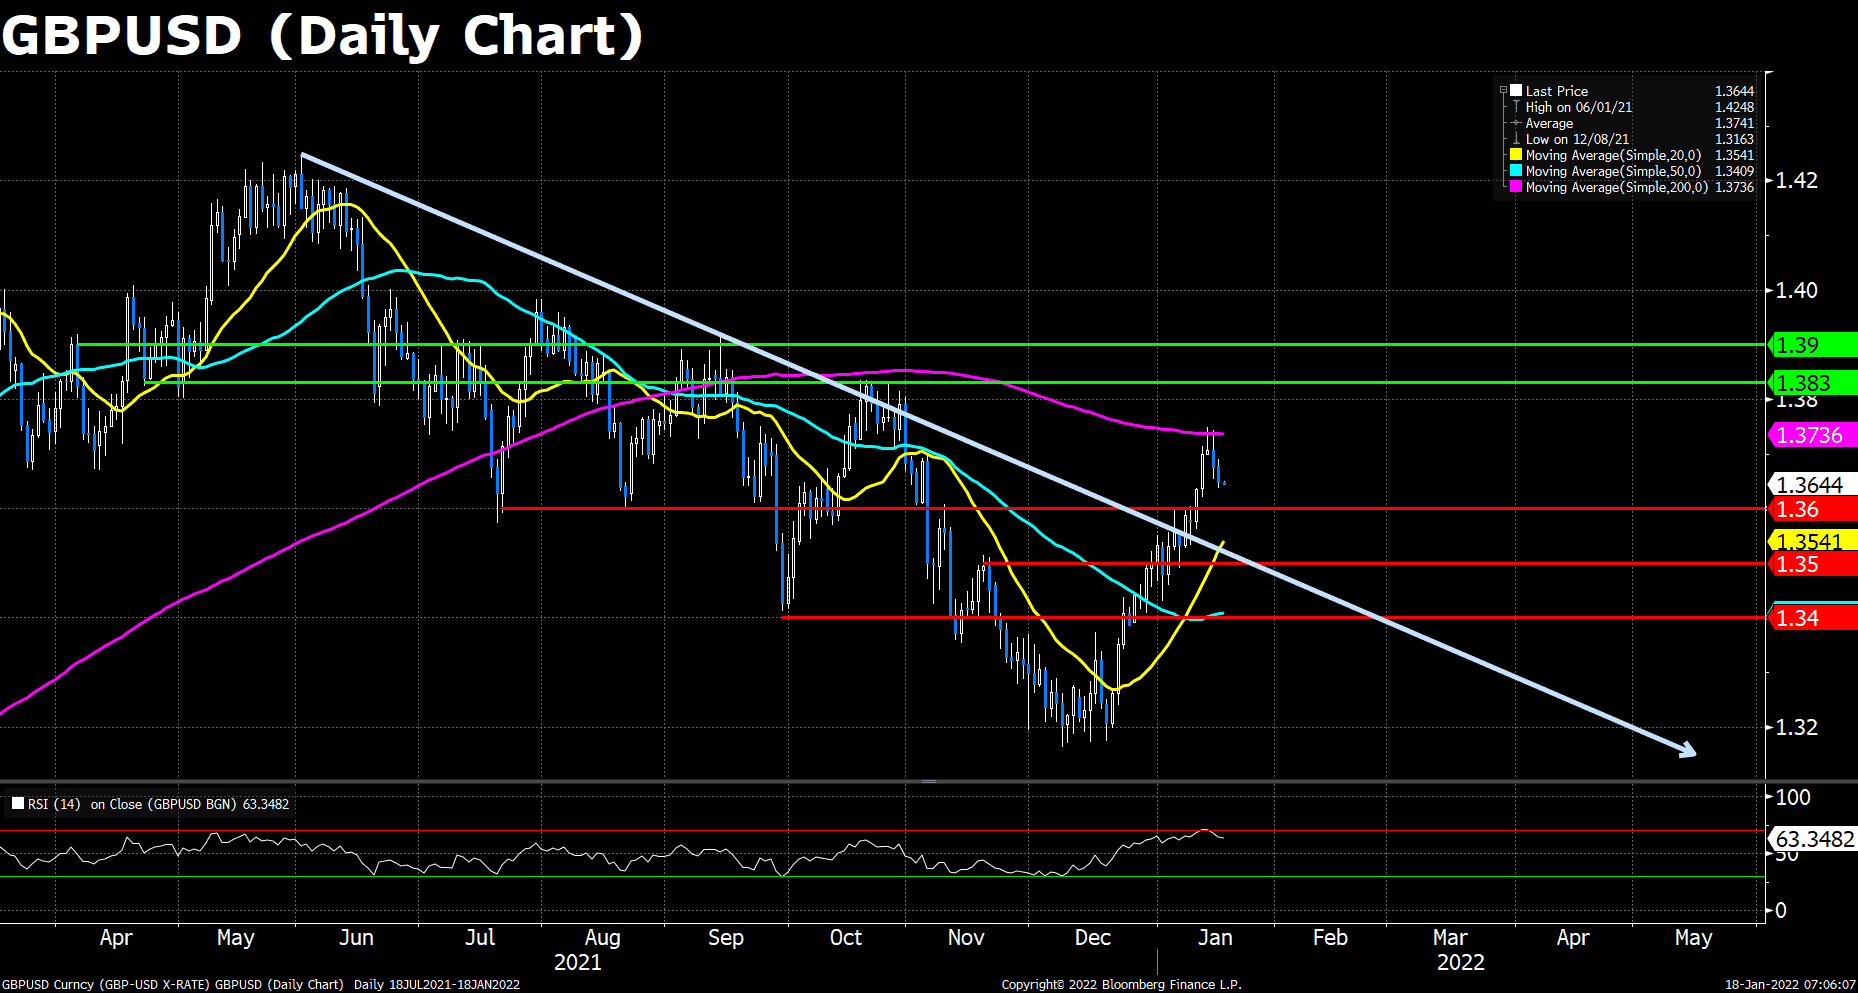
Cable continued to drop amidst a stronger Dollar across the board. Strong selling pressure appeared once the European session began.
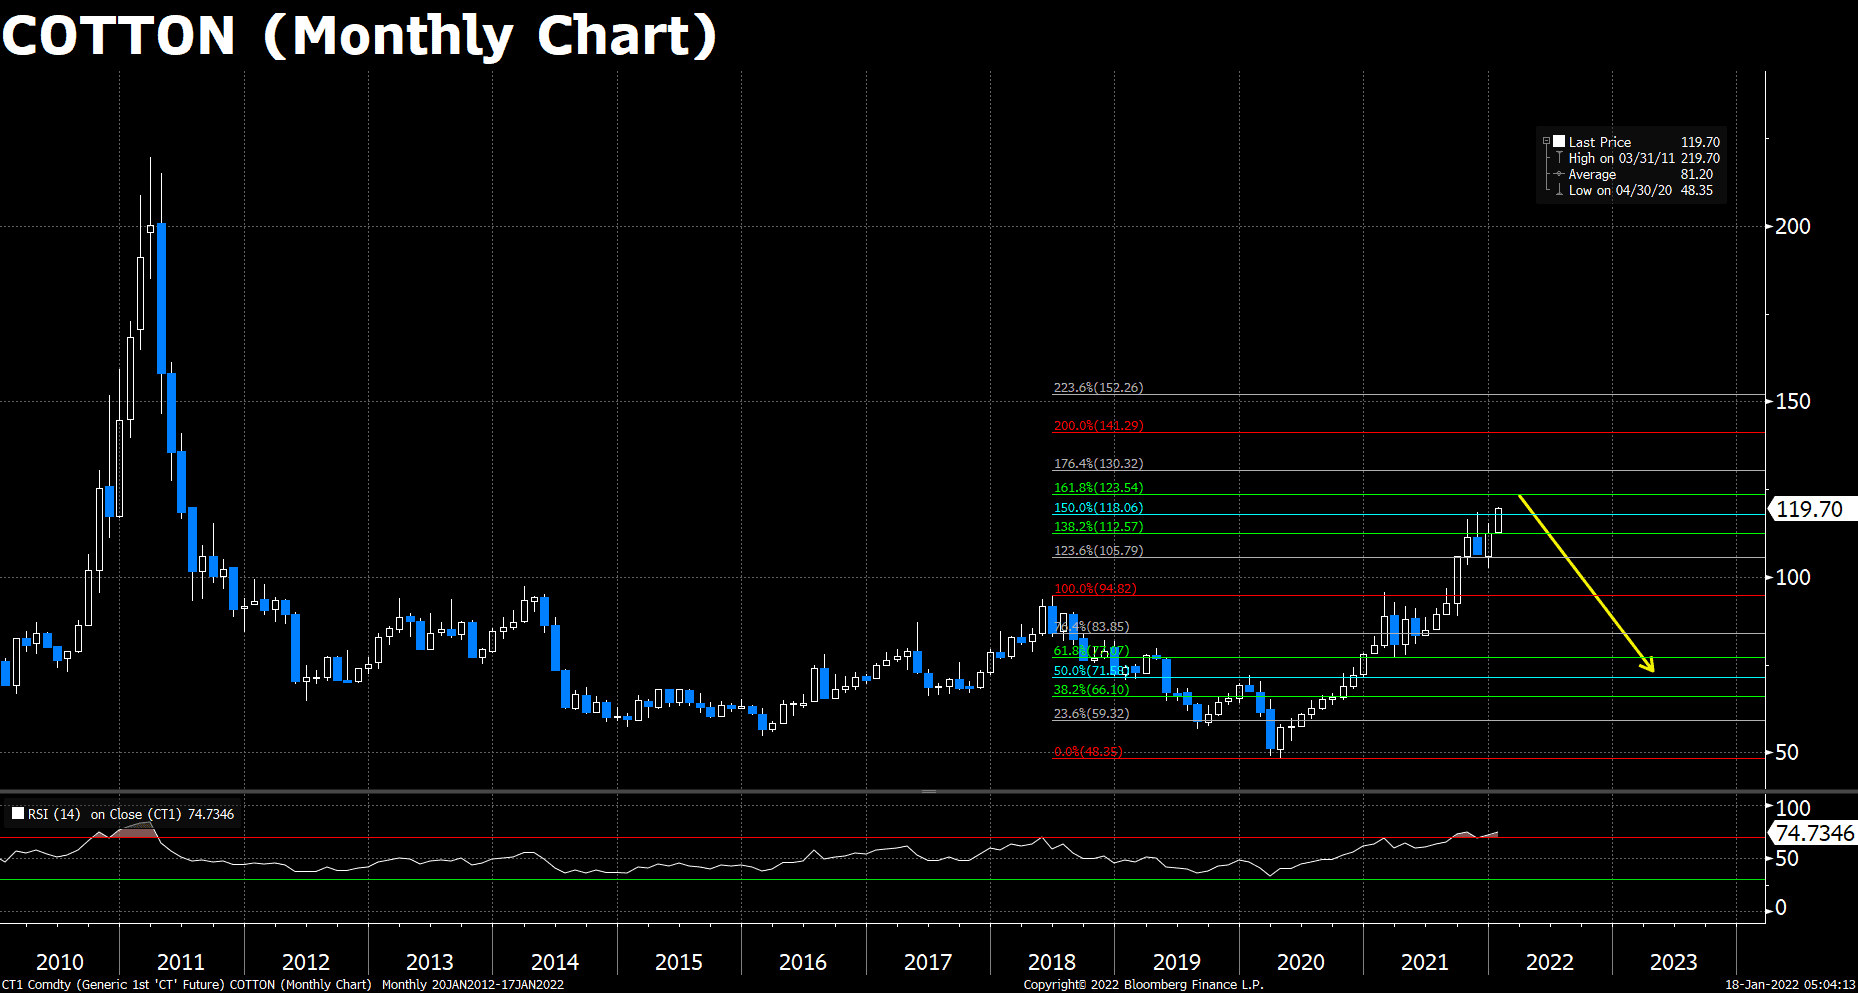
Cotton has gained steam over the past month, as global demand for the commodity continue to rise and supply interrupted due to unfavorable weather conditions.
Natural gas has resumed to trading around 4.11 as the supply chain issue, which appeared last week, eases. Demand for the commodity remains high, but it remains to be seen if the commodity will recapture the 6.6-dollar mark of late 2021.
Technical Analysis:
The GBP/USD pair edged lower on Monday, following last Friday’s sharp retreat from a three-month high above 1.373 level. The pair was surrounded by bearish momentum and dropped to a daily low during Asian and European session, staying relatively quiet below 1.3700 heading into the New York session. At the time of writing, GBP/USD pair started to see fresh selling and targeted at 1.3600 area. The cable was last seen trading at 1.3645.
For technical aspect, RSI indicator reads 63.35 as of writing, suggesting bulls still robust at the moment. In conclusion, we think market will be bearish as the pair failed to gain a sustained strength beyond the 200 DMA. The pair could extend its downward correction toward 1.360.
Resistance: 1.3736 (200 DMA), 1.3830, 1.3900
Support: 1.3600, 1.3500, 1.3400
Cotton continues trading with a positive bias, and it is for the first time in a decade when cotton prices has fetched the farmers above $100, not to mention the current price near $120. The multi-month price rally was mainly because of the surging demand recovery post-COVID, followed by a drastic fall in production due to unfavorable weather conditions. However due to expensive offers, there are chances of an increase in selling interest as the market prices are quite lucrative profits. That is, a correction is expected in the next few weeks.
On the technical, cotton prices have breached the 150% Fibonacci and are approaching the 161.8% resistance. The RSI reads 74.73, suggesting that cotton has been highly overbought, and the cotton price is highly likely to experience a correction in the near term. We expect the price of the cotton to drop to around $95 if it is blocked by the 161.8% or 176.4% Fibonacci, and the price will further decline to normal (around $66) around 2022 Autumn, when the season for cotton harvest begins.
Resistance: 123 (161.8% Fib), 130 (176.4% Fib)
Support: 105 (123.6% Fib), 95 (100% Fib)
In last week’s trading, natural gas price surged to monthly highs around $4.80, though it dropped sharply in the coming days, the price actions remain above $4.00 per MMBtu. Recent volatility in the natural gas price derived from the winter weather expectations, the potential for extreme weather events such as the latest cold snap in northeast America, and a rise in demand for natural gas imports in Europe and Asia. As the supply chain bottleneck is expected to ease at the second half of 2022, the natural gas demand is likely to remain resilient in the short term, but will slightly fall once the supply catch up with the demand.
As to technical, natural gas prices have broken through its past resistance $4.00, once bounced off the next resistance at $4.80, and linger around $4.20 per MMBtu as of writing. The price action is now above its 20 and 200 DMA, and just slightly below the 50 one. The RSI reads 53.13, suggesting a neutral-to-bullish sentiment. The uptrend of the pair seems convincing, eyeing on the $4.80 price level.
Resistance: 4.80, 5.50
Economic Data:
|
Currency |
Data |
Time (GMT + 8) |
Forecast |
|
|
JPY |
BoJ Monetary Policy Statement |
Tentative |
||
|
JPY |
BoJ Outlook Report (YoY) |
Tentative |
||
|
JPY |
BoJ Press Conference |
Tentative |
||
|
GBP |
Average Earnings Index +Bonus (Nov) |
15:00 |
4.2% |
|
|
GBP |
Claimant Count Change (Dec) |
15:00 |
-38.6 K |
|
|
EUR |
German ZEW Economic Sentiment (Jan) |
18:00 |
32.0 |
|


