Daily Market Analysis
Market Focus
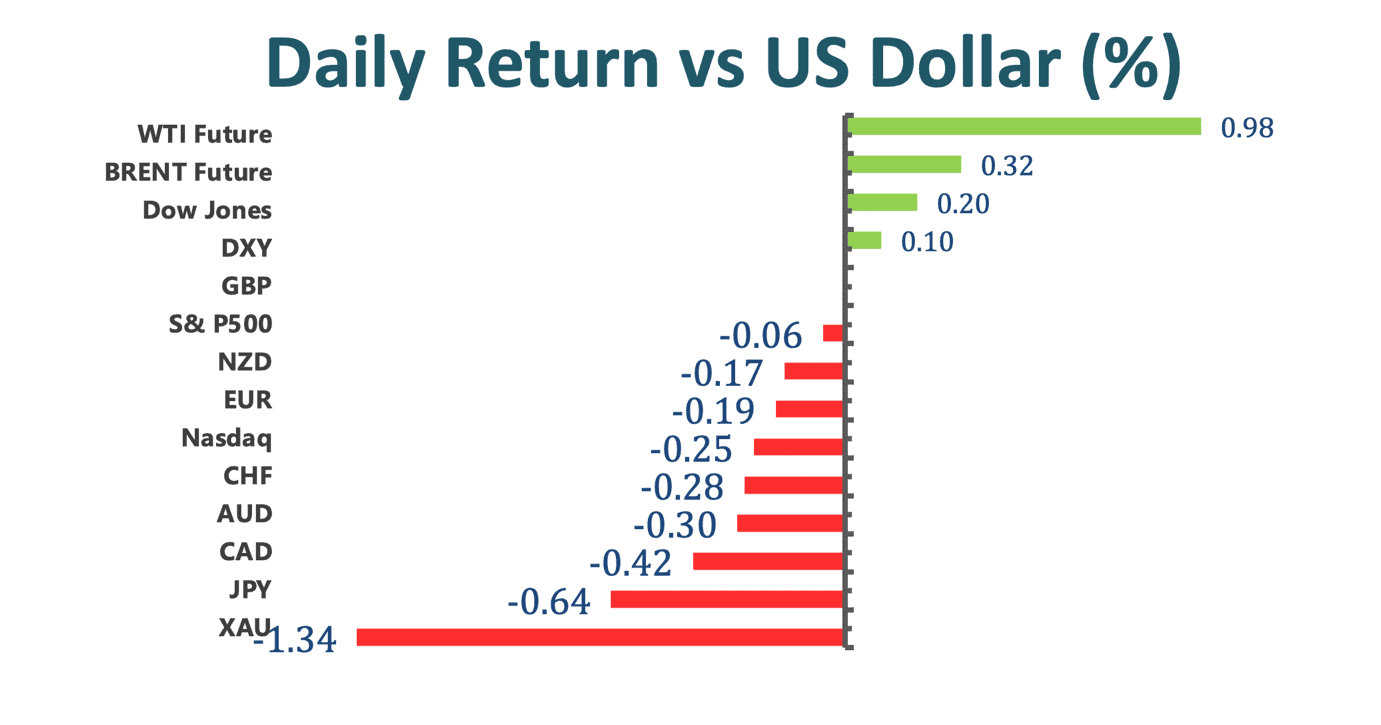
US bond yields surged to the highest in a year, while American stocks climbed to records as optimism over the economic recovery continued to ripple through markets. The yield on the benchmark 10-year Treasury note increased as much as nine basis points to 1.30%, the highest since Feb 2020. Global bonds extended the worst start to a year since 2013.
The S&P 500, Nasdaq, and Dow Jones all set records Tuesday before easing from the highs. The MSCI benchmark for emerging and developed market stocks snapped an 11-session winning streak. The reflation trade is powering assets tired to economic growth and price pressure, including commodities and cyclical stocks. At the same time, investors are riding a wave of speculative euphoria from penny stocks to Bitcoin amid abundant policy support.
According to Eric Freedman, chief investment officer at US Bank Wealth management, “We certainly have data that suggests that being more glass half full than glass half empty remains the right posture. People are looking at parts of the world as well as sectors that have been underperforming and saying, ‘hey this is maybe the next part of the market that heads higher.’”
Market Wrap
Main Pairs Movement
EURUSD trades near the 1.2100 level, down for the day, amid renewed demand for the greenback. US equities are struggling around their opening levels while Treasury yields are surging.
AUDUSD eased from 0.7804, with bulls still in charge despite the poor performance across Wall Street.
The Loonie pair has witnessed a slide during the Asian session, losing almost 60 pips, and touched a fresh multi-week low at 1.2610. Nevertheless, thanks to the solid crude oil prices, the pair modestly recovered its loss and is later seen trading around the high of 1.2690s.
The DXY captures some positive traction on Tuesday and has surpassed the 90.50 level. The reflation trade has been gathering pace which has seen investors move over to riskier asset classes in the past number of trading session where US oil prices rallied to fresh cycle highs.
Technical Analysis:
USDJPY (Four-hour Chart)
USDJPY successfully broke above the key resistance at 105.68 and advanced towards the 106.00 zone in the American session. The 10-year US bond is up nearly 4% and the USD Index has reclaimed 90.50 threshold, both supported the greenback to overwhelm its JPY rival. From a technical perspective, the bullish trend of the pair is supported by the 21-Day SMAVG and MACD histogram. However, because the RSI has topped the 70 overbought threshold, it is inferable that the USDJPY pair might not advance above the psychological resistance at 106.00 in the short-term. On the upside, if USDJPY can penetrate 106.00, then the next resistance would be around 106.17, which is a price zone last seen in Oct 2020. On the flip side, if the current bullish trend is reversed, the most immediate support would be 105.68, then 105.30, followed by 105.07.
Resistance: 105.96, 106.17
Support: 105.68, 105.30, 105.07
GBPUSD (Four-hour Chart)
Ever since the greenback found demand in the early US session, the GBPUSD pair has remained confined between a compacted region between the high 1.3800s and low 1.3900s. A stronger than expected NY Empire State Manufacturing Index Survey and a surging US 10-Year bond are fueling fresh demands for the greenback. The sterling continues to be supported by the drop in UK covid cases. From the 4-hour chart, we can see that the Cable pair is still on a bullish run, indicated by the 15-Day SMAVG; and at the same time, because today’s pullback has cleared some room in the pair’s RSI reading, it is likely that GBPUSD can resume its prior rally. However, before reclaiming the surging momentum, the bulls must first find acceptance above the most immediate resistance near 1.3939.
Resistance: 1.3939, 1.4025
Support: 1.3881, 1.3849, 1.3787
XAUUSD (Four-hour Chart)
With a broad based risk-on sentiment and a strengthened USD, the precious metal plummeted below $1800 and is currently trading around $1794. The Gold has been on the back foot for nearly a week, and the current market is still pretty much biased against the bulls as indicated by the 29ish RSI reading. Although the RSI is implying an upward correction is likely, the precious metal can still dive down further towards the $1778 support if the bulls remain unable to carry the sell-off weight of XAUUSD. Moreover, with both 60-Day SMAVG and MACD histogram signaling a bearish trend, it would not be prudent to place any long position of the yellow metal until the Gold price is rejected solidly in its most immediate support level at $1789 and regains some momentum back on top over the $1800 threshold.
Resistance: 1808.50, 1818.24, 1829.73
Support: 1789.28, 1778.28
Economic Data
|
Currency |
Data |
Time (TP) |
Forecast |
||||
|
GBP |
CPI (YoY) (Jan) |
15.00 |
0.6% |
||||
|
EUR |
ECB Monetary Policy Statement |
16.00 |
– |
||||
|
USD |
Core Retail Sales (MoM) (Jan) |
21.30 |
1.0% |
||||
|
USD |
PPI (MoM) (Jan) |
21.30 |
0.4% |
||||
|
USD |
Retail Sales (MoM) (Jan) |
21.30 |
1.1% |
||||
|
CAD |
Core CPI (MoM) (Jan) |
21.30 |
– |
||||


