Daily Market Analysis
Market Focus
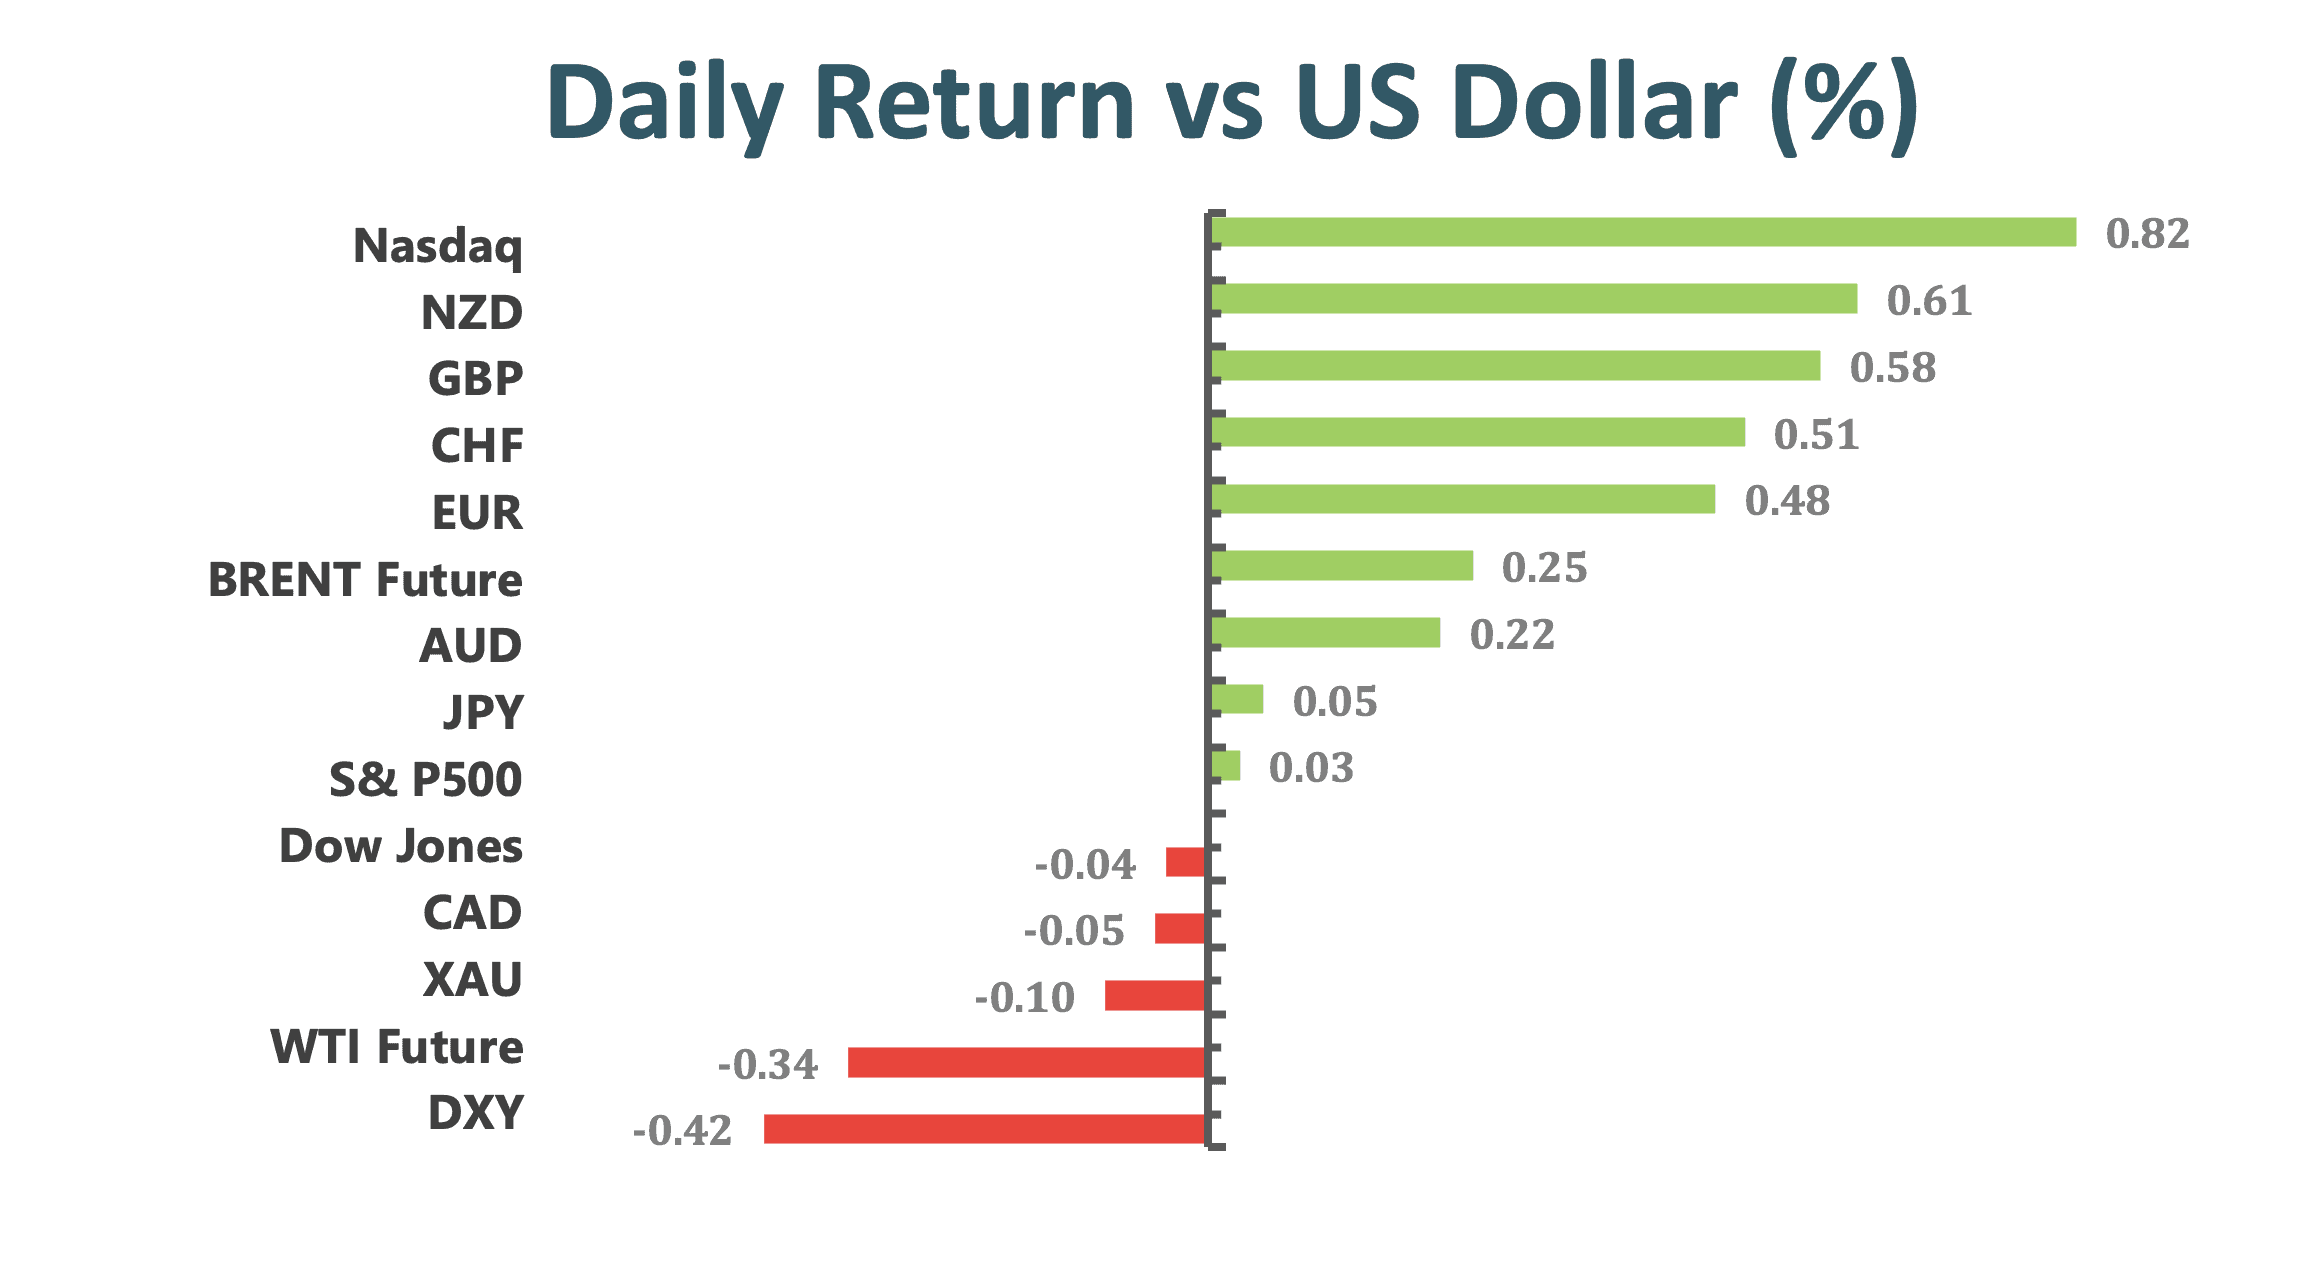
U.S. stocks eked out a gain to close at a record with tech shares lifting the major indexes on anticipation that more fiscal spending will revive economic growth and bolster corporate earnings. The dollar weakened. The S&P 500 Index rose a bit more than one point, while the Nasdaq indexes rose at least 0.5%. Risk appetite has gotten a boost from President Joe Biden’s push for nearly $2 trillion in additional spending and plans to jumpstart a federal response to the pandemic. Benchmark Treasury yields remained higher after initial jobless claims posted a small decline.
U.S. equities remained at records with stretched valuations as earnings continue to roll in. Intel Corp. reported fourth-quarter revenue that topped expectations. Investors continue to bet on another stimulus package from Biden as the president ramps up the federal response to the pandemic. European Central Bank President Christine Lagarde warned the virus continues to pose a serious risk after policy makers voted to keep pumping unprecedented amounts of stimulus into the economy.
Meanwhile, fresh tensions surfaced between U.S. companies and Beijing. China’s three biggest telecommunications firms said they requested a review of the New York Stock Exchange’s decision to delist their shares. Separately, Twitter Inc. locked the official account of the Chinese embassy to the U.S., citing a violation of its “dehumanization” policy.
Market Wrap
Main Pairs Movement
The Canadian dollar set a two-year high, and then faded, after Bank of Canada Governor Tiff Macklem said the nation’s economy is flush enough with stimulus to survive the current downturn and doesn’t need additional help from monetary policy. The euro held gains amid news that the European Central Bank was seeking new gauges to inform its stimulus debate.
The loonie later pared gains and was among the worst performers among Group-of-10 after hitting its highest level since April 2018. It surrendered some gains after Macklem said a weaker dollar may mean looser Canadian monetary policy. USD/CAD is almost flat at 1.2628; fell as much as 0.4% to 1.2590, the lowest since April 2018.
ECB announced on Thursday that it may not spend the full 1.85 trillion euros available, but can also recalibrate the program, if need. President Christine Lagarde said growth risks are to the downside but less pronounced. She also stressed the need for more fiscal policy and said they should be expansive, targeted, and temporary.
A gauge of the greenback trimmed losses though remained broadly lower; the gauge is poised for a fourth session of declines, its longest streak since mid-December.
Technical Analysis:
EURUSD (4 Hour Chart)
On Thursday, euro dollar implied volatilities atypically stayed firm and the curve steepened immediately following the European Central Bank’s announcement that it left policy largely unchanged. Usually, implied volatilities often decline after an event-risk passes. EUR/USD is up 0.5%; reached 1.2173 as Italian and German bond prices extended declines in the wake of the ECB.
From technical perspective, euro not fully support by long-term SMAVG indicator as it remain downward trend while short-term propel upward. Moreover, MACD indicator is go over positive threshold. RSI indictor also shows an optimistic upward momentum as it close 62 gird, suggesting a bullish trend for short term at least. Therefore, we expect first crucial resistance is at current stage on 1.216 as price action suggesting, 1.2205 following.
Resistance: 1.216, 1.2206
Support: 1.2115, 1.2077, 1.2054
GBPUSD (4 Hour Chart)
Sterling rose earlier on Thursday to 1.3745, peak level since April 2018, then back slightly while market close. Sterling is finding a psychological support on 1.37 while its breakthrough a critical resistance as price action suggestion. The binge upward momentum amid risk appetite and a weaker greenback. Benign economic data from the U.S. did not spur greenback.
From a technical perspective, sterling’s recent rise is supported by short and long term SMAVG and MACD, both indicators are touted to higher level, moreover, golden cross pronounced the bullish trend suggestion. Additionally, as the RSI has constantly forayed to forward to torrid condition which close at 65.7 around, it seemingly still a way to gain another upward momentum before 70 figures. All of all, the first priority is kept lid on go beneath 1.37 support level for bullish aspect, then it’s a lot of upward space for sterling.
Resistance: 1.375
Support: 1.37, 1.3625, 1.3541
XAUUSD (4 Hour Chart)
The Gold is now trading around 1870 with a flat move in daily market, nearing its most immediate resistance around 1871, whilst strong U.S. eco data was released. On the other hands, greenback ebbed momentum beef up the yellow metal demand and price coup. At the meantime, market is lacking critical momentum driver for swirl gold market.
For technical aspect, short term SMAVG indictor is golden cross with descend long-term SMAVG indicator, which a bullish trend suggestion yet the fly in the ointment is tamp down long-term indicator. For RSI view, indictor creep up with fluctuate movement to 59 as market close, suggesting a bullish trend ahead. MACD also prop up the bullish guidance as it at positive zone.
If the precious metal can penetrate the $1871 resistance level, the next resistance can be found at $1882, then $1891. On the flip side, the cushions for the pair are $1847, $1839, and $1823.
Resistance: 1871, 1882, 1891
Support: 1847, 1839, 1823
Economic Data
|
Currency |
Data |
Time (TP) |
Forecast |
||||
|
NZD |
CPI (QoQ)(Q4) |
05:45 |
0.1% |
||||
|
AUD |
Retail Sales (MoM) |
08:30 |
|||||
|
GBP |
Retail Sales (MoM)(Dec) |
15:00 |
1.2% |
||||
|
EUR |
German Manufacturing (Jan) |
16:30 |
57.5 |
||||
|
GBP |
Composite/Manufacturing/Service PMI (Jan) |
17:30 |
50.7/57.3/49.9 |
||||
|
CAD |
Core Retail Sales (MoM)(Nov) |
21:30 |
0.3% |
||||
|
USD |
Existing Home Sales (Dec) |
23:00 |
6.55M |
||||


